Track 8,700 Hedge Funds + Daily AI Stock Research.
Find Quality Before the Crowd.
8,700 hedge funds + 2,800 stocks AI-scored. Straight from SEC filings, updated daily.
No credit card · 13F data, fund profiles, market overview — all free
Get the free Daily AI Brief
The AI analysts’ top calls and the day’s market read — every morning. Sign up free and we’ll email you the latest one right now.
Where Do Your Stocks Rank?
We AI-score 2,800+ stocks on revenue growth, margins, ROE, FCF, balance-sheet strength, earnings quality and institutional flow. Sign up free to unlock every rank, score, and AI verdict.
 NVDA
NVDANVIDIA Corp
Semiconductors
 APP
APPAppLovin Corp
Software
 AAPL
AAPLApple Inc.
Consumer Electronics
 PLTR
PLTRPalantir Technologies
Software
 META
METAMeta Platforms
Internet
 MSFT
MSFTMicrosoft Corp
Software
 AMD
AMDAdvanced Micro Devices
Semiconductors
 HOOD
HOODRobinhood Markets
Brokerage
 COIN
COINCoinbase Global
Crypto Exchange
 AMZN
AMZNAmazon.com Inc.
E-Commerce
Five Years of Score History, on Every Stock
Scores aren't snapshots — they're records. Watch quality improve or deteriorate quarter by quarter, back to 2021. Hover to explore.
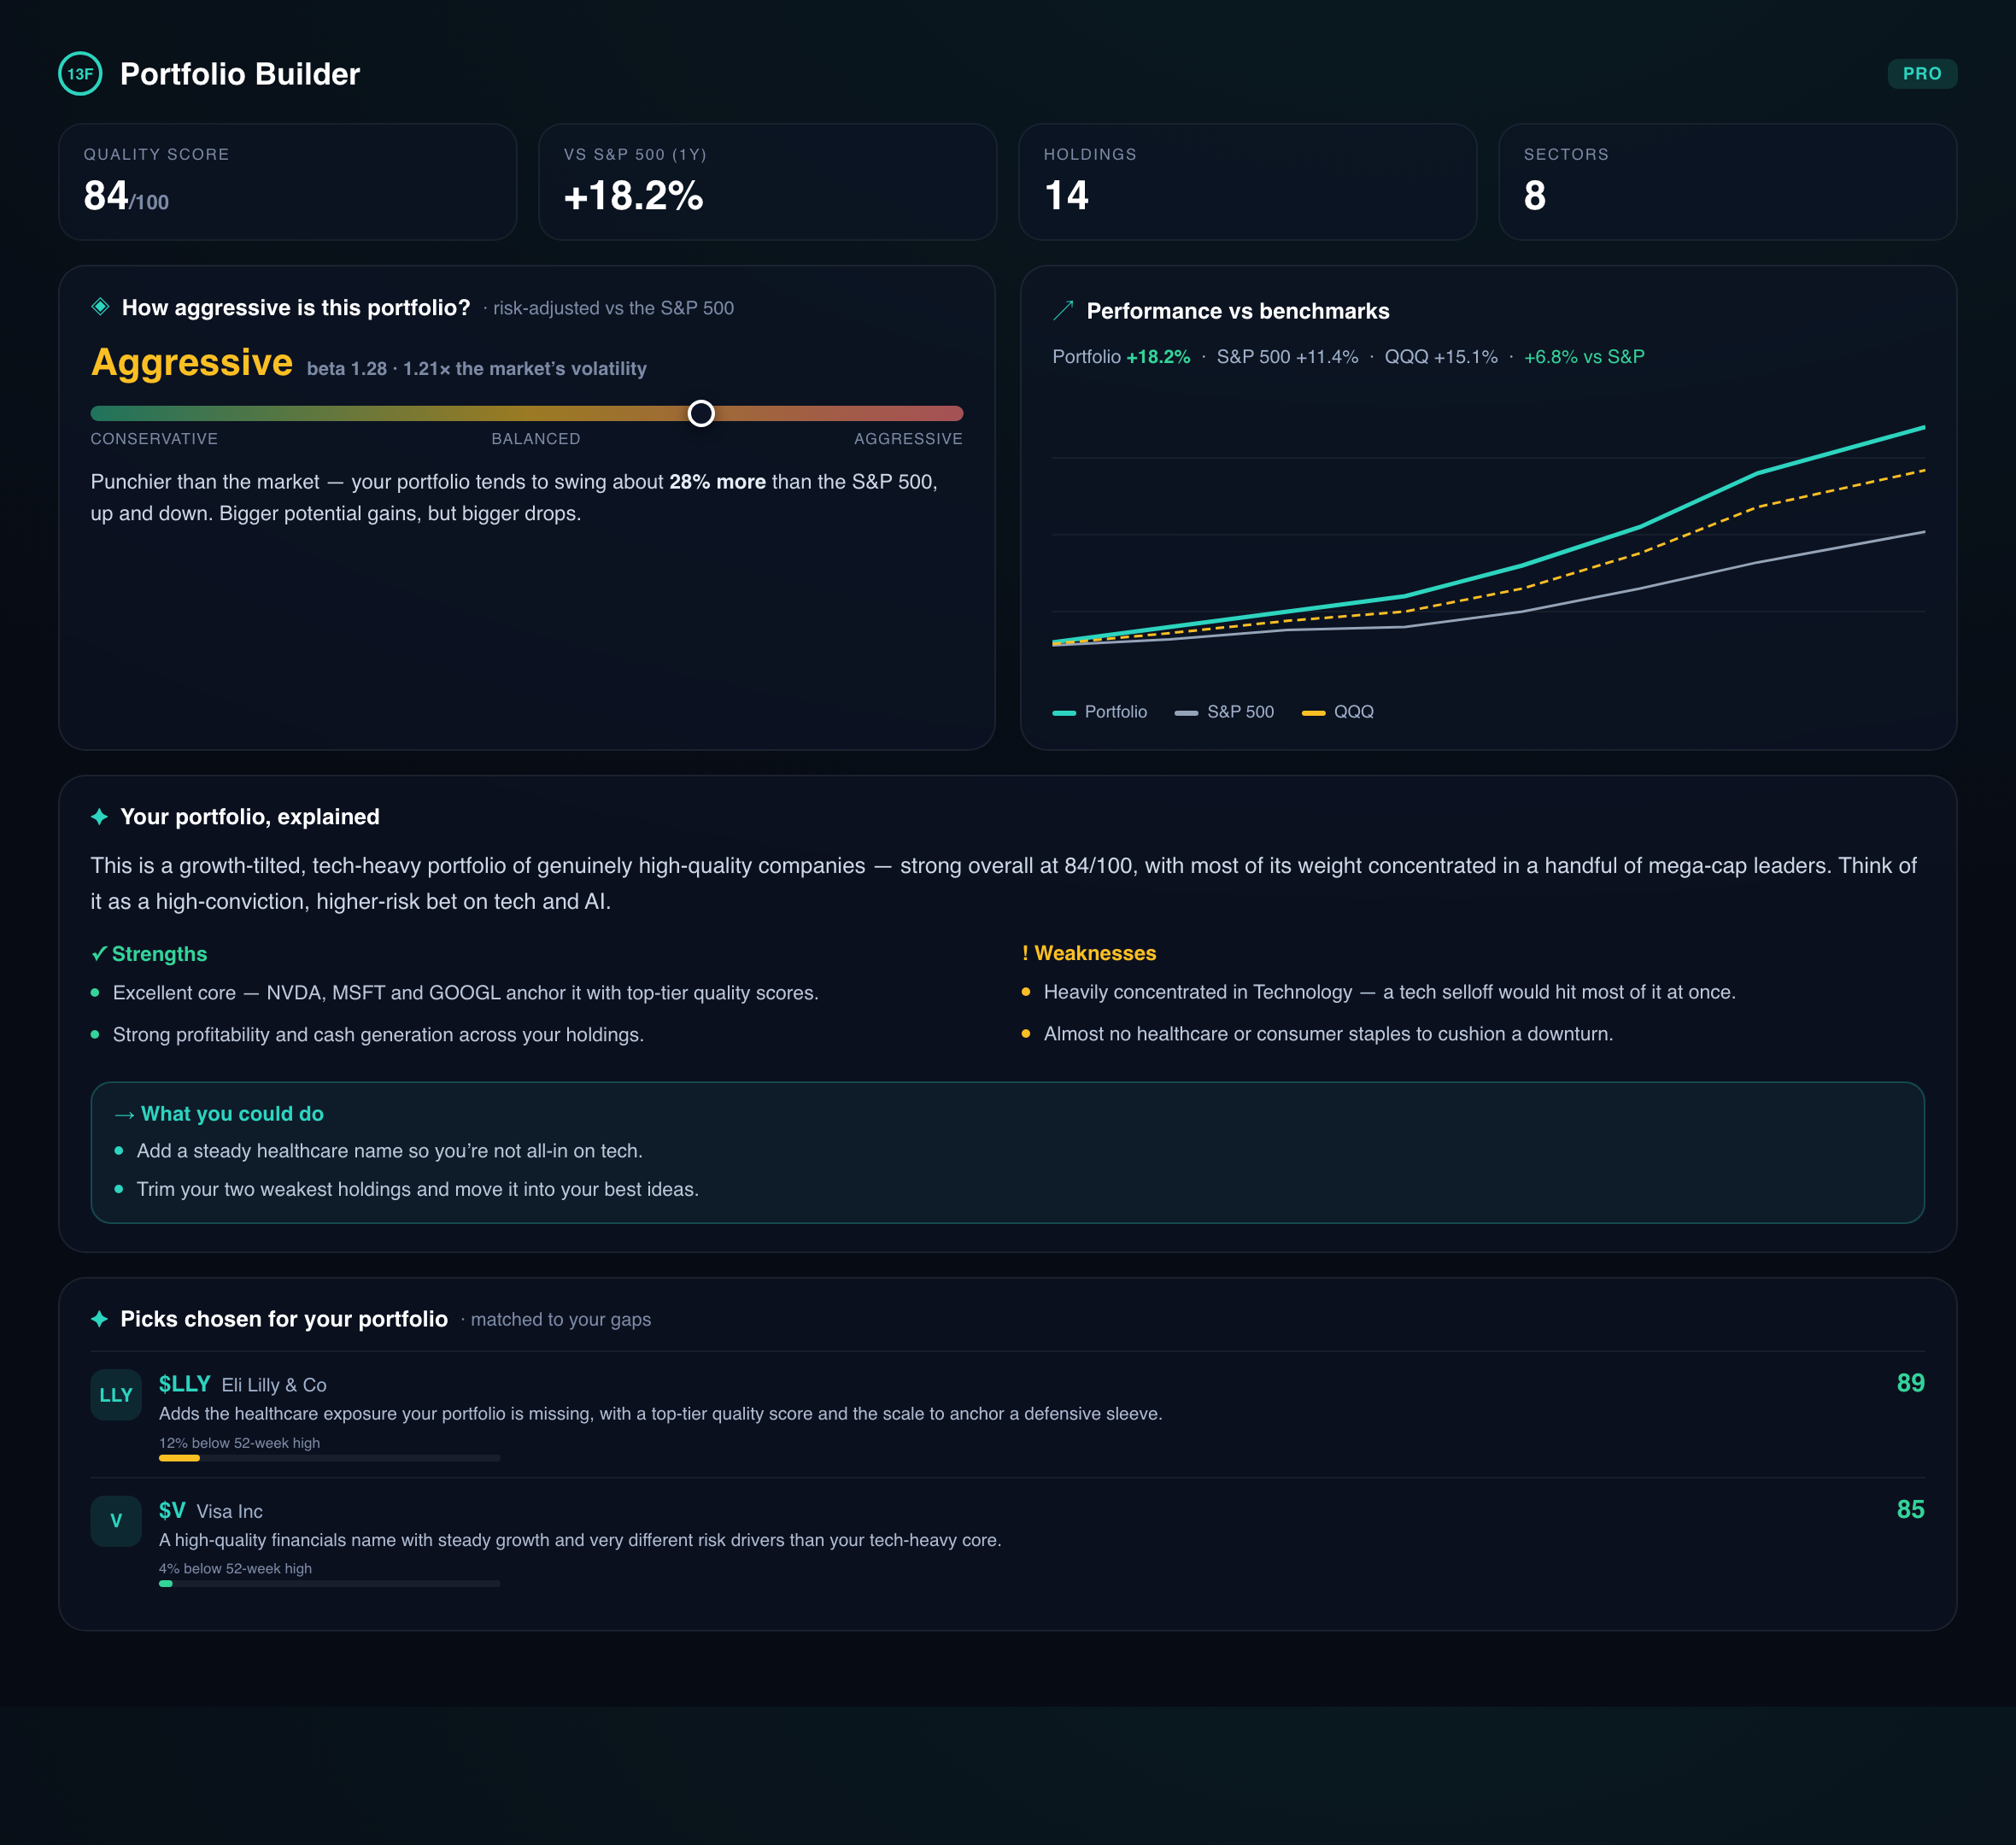
Build a portfolio. Score it. Benchmark it.
Build by sector or company, upload your own, or copy a hedge fund’s 13F holdings — then see its weighted quality score, sector mix, and backtested performance vs the S&P 500 and QQQ, with AI insights that read the composition, performance, and risks.
- An AI quality score for every holding (2,800+ names)
- Backtested benchmark chart vs the S&P 500 & QQQ
- Copy Berkshire, Pershing Square, Scion & more in one click
- Plain-English AI summary of strengths, risks, and how aggressive it is
Returns are backtested on your current weights — a simulation, not actual realized performance. Past performance doesn’t predict future results.
Unlock AI rankings across 2,800+ stocks, the AI Screener, real-time Bull Pen, AI portfolio & daily AI meeting —
What you get on the free plan
- Full 13F institutional holdings — search 8,700+ funds, profiles & flows
- Company profiles — financials, filings, insiders & institutional ownership
- Live market overview — news, insider activity & activist alerts
- Economic indicators — yield curve, inflation, jobs & the Fed calendar
- AI Bull Pen — 10 AI analysts debating stocks (24-hour delay)
Search any stock or fund
Type a ticker or a hedge fund. We pull it straight from SEC EDGAR — no third-party data vendors.
See the AI verdict
An instant quality score across the factors that drive returns, plus who's accumulating it.
Find quality before the crowd
Rank the whole universe, screen in plain English, and follow what the smart money is doing.
Start free in under a minute
Hedge fund holdings plus AI stock research, straight from SEC filings. No credit card required.
Simple, Transparent Pricing
Start free. Upgrade when you need deeper intelligence.
Free
Full access to 13F institutional data and market overview.
- 13F institutional holdings — full search, fund profiles, flows
- Economic indicators dashboard — yield curve, inflation, jobs data, Fed calendar
- Market overview dashboard — news, insider activity, activist alerts
- Company profiles — financials, filings, insiders, institutional holdings
- AI Bull Pen — 24-hour delay, read-only
Pro
$6.67/mo · cancel anytime
Unlock the full research platform — real-time AI debates, stock rankings, and daily intelligence.
- Everything in Free, plus:
- Portfolio Builder — build a portfolio by sector, company, or fund; AI quality score + backtested benchmark vs the S&P 500 & QQQ
- Composite stock rankings — quality-scored across 2,800+ companies
- Sector-level rankings with breakdowns by industry
- AI Screener — unlimited natural-language stock screening
- Real-time AI Bull Pen — 10 AI analysts debating stocks live, no delay
- AI-managed portfolio with real-time P&L tracking
- Daily AI investment meeting with executive summary + PDF transcript
- AI Trend Insights — financial & ratio trends with quarter-by-quarter AI commentary
- Full company research — financial trends, insider transactions, institutional flows
- Searchable 13F fund profiles for 8,700+ institutional investors
Pro+
$16.67/mo · cancel anytime
Institutional-grade analysis — ML-powered rankings and exportable research.
- Everything in Pro, plus:
- Hedge Fund Overlap Comparison — find the funds most similar to any of 8,700+ institutions
- Machine Learning cluster analysis — K-Means + SVM classification across all sectors
- AI Cluster Time-Lapse — watch fund-style clusters migrate over a decade + Leader forecast
- Valuation rankings — earnings yield, FCF yield, revenue/price scoring
- Institutional-grade PDF reports — ML clusters, composite rankings, valuation analysis
- Daily meeting transcript PDFs with key takeaways
- AI Portfolio performance reports
- Full data downloads on all pages